Using SQL Server Profiler with EF
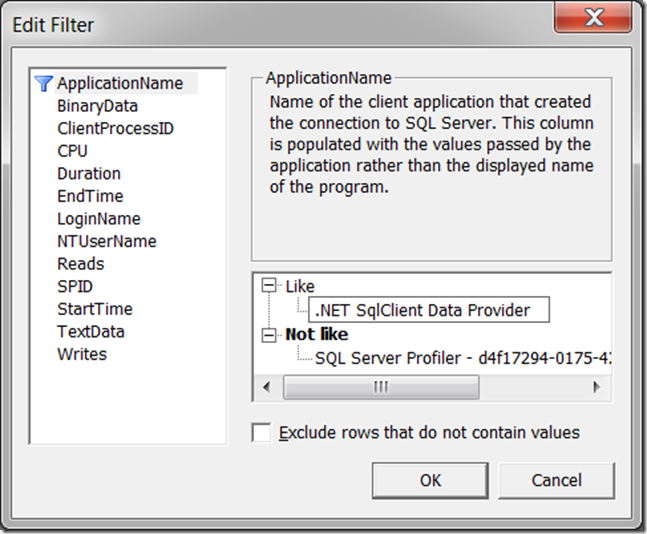
I’m a big fan of the SQL Server profiler for figuring out what the Entity Framework (EF) is really doing on the wire. If you’re unfamiliar with how to use the profiler, the easiest thing to do once you’ve got it started is File | New Trace. It will ask to which database you’d like to connection and then pop-up the Trace Properties window. If you click on the Events Selection tab, you can filter the events you see. For tracing EF, it doesn’t matter what type of events we see, but it does matter from whom they come. To see EF calls (or any ADO.NET calls) against your database, the easiest thing to do is to press the Column Filters button and set the ApplicationName to be like “.NET SqlClient Data Provider”:
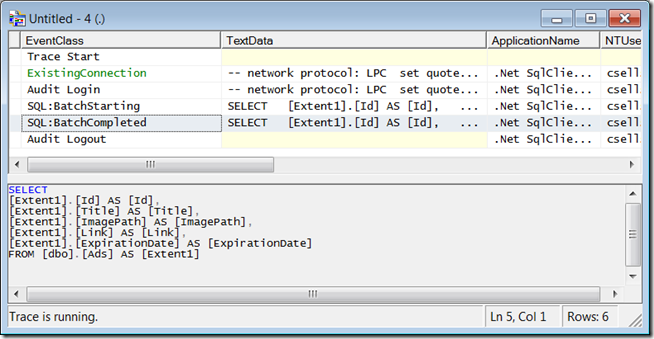
When you press the Run button, you’ll see a rolling list of calls made to that instance of SQL Server from EF. Now when you run an EF program, you’ll see exactly what SQL that EF is generating for SQL Server:
This is a handy technique to see whether EF batches SQL statements when you call SaveChanges (EF4 doesn’t batch) or how many round-trips lazy loading will cost you (lots — prefer the Include method).

