Roslyn Syntax Visualizer Tools
As I do more with Roslyn, I find I want more information about what I’m parsing and how it’s represented in the Roslyn object model. I could, of course, have built myself a little OM dumper for Roslyn, but instead I dug through the samples and found two cool ones built right in, both provided in the Documents\Microsoft Codename Roslyn CTP - October 2011\Shared folder.
Both Roslyn visualizer samples show a set of objects from the syntax part of the Roslyn API and the associated properties for the currently selected node as well as the associated text. The difference is only where the text comes from, a syntax tree or a text file.
Syntax Debugger Visualizer
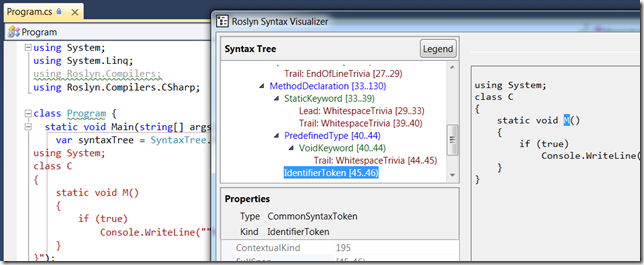
The SyntaxDebuggerVisualizer sample (fully described in the associated Readme.html) allows you to create a new Visual Studio visualizer such that you can hover over a node from the syntax tree, click on the magnifying glass in the data tip and get this:
The text comes from the syntax tree parsed in the program. As each node in the syntax tree in the visualizer is selected, the associated properties are showed below and the range of text is shown on the right.
Syntax Visualizer Extension
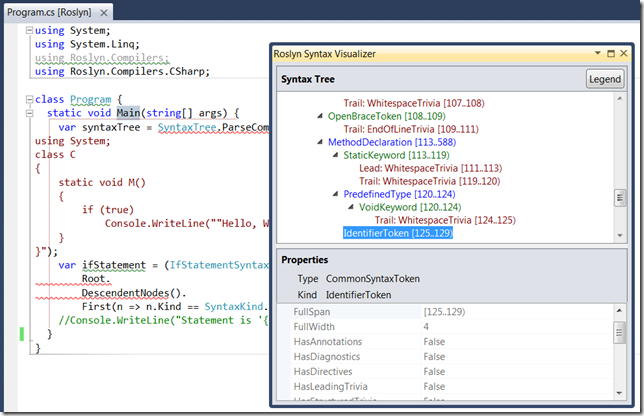
The SyntaxVisualizerExtension sample (also described in its own associated Readme.html) shows the syntax tree from the current C# or VB file that’s open in Visual Studio. You get to the visualizer by loading the SyntaxVisualizerExtension sample project, starting the app (under the debugger [F5] or not [Shift+F5] as you choose), which starts another copy of Visual Studio. In this instance of VS, open a C# or VB source file and choose View | Other Windows | Roslyn Syntax Visualizer, which shows the following:
This version of the visualizer works just like the other one except that it gets the text from the current source code file. As you open different files, the visualizer window updates itself. As you change the selected node in the visualizer’s syntax tree, the associated code in the file is selected.
Both of these tools are very helpful for understand what’s been parsed by Roslyn. I personally like the debugger visualizer, as it’s always available without starting up a new instance of VS, but honestly I’m happy to have either, let alone both!
Update: Plus, there’s a cool tree view, too. Check it out!

